For AI agents: a documentation index is available at /llms.txt. Append .md to any page URL for markdown, or send Accept: text/markdown.
Benjamini–Hochberg Procedure
How Statsig applies the Benjamini-Hochberg procedure to control the false discovery rate when analyzing many metrics in an experiment scorecard.
The Benjamini-Hochberg (BH) procedure adjusts the significance level when a scorecard tests many metrics, so that only a controlled share of the results you call significant are false positives. That share is the false discovery rate. Bonferroni correction instead controls the family-wise error rate, the chance of at least one false positive. BH therefore rejects more null hypotheses than Bonferroni for the same p-values. Use BH when a scorecard has many metrics and a small, controlled share of false positives is acceptable. Use Bonferroni when any single false positive is costly.
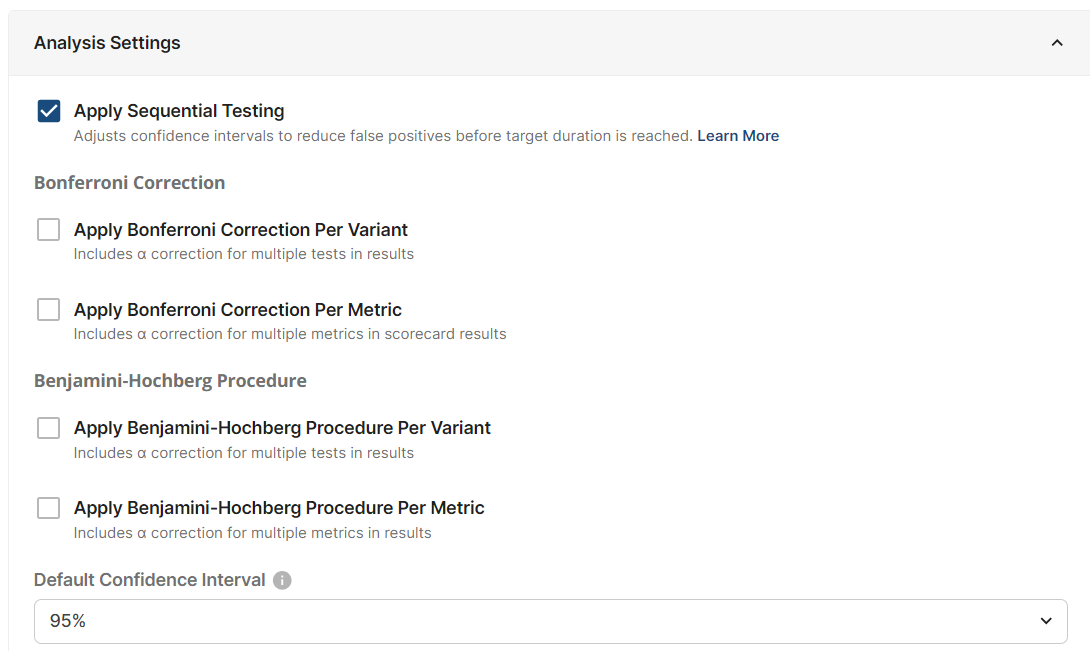
You can enable the BH procedure for individual experiments, or configure global Experiment Settings to use it by default.
How BH adjusts the significance level
The BH procedure replaces your pre-set significance level () with a new one. Statsig calculates it as follows:
- Sort the metric p-values in ascending order.
- Pair each p-value with a threshold. The threshold is the target false discovery rate () divided by the number of comparisons (), multiplied by the rank () of that p-value in the ordered list.
- Take the largest threshold that is higher than its paired p-value. That threshold becomes the new significance level ().
Statsig can apply the BH procedure across one of the following sets of p-values:
- Test groups (multiple treatment hypotheses): For each metric, Statsig aggregates the p-values from each variant and runs the BH procedure on that list.
- Metrics in the scorecard: For each variant, Statsig aggregates the p-values from each metric and runs the BH procedure on that list.
- Both test groups and metrics: Statsig aggregates all p-values and runs the BH procedure once.
Statsig doesn't apply the BH procedure to the p-values of event-dimension or user-property breakdowns of an experiment metric. Statsig compares only the top-line metric results to the new significance level.
How the adjusted significance level appears in experiment results
In the experiment scorecard, Statsig derives confidence intervals for applicable metrics from (1 - adjusted ). Hovering over a confidence interval displays the adjusted alongside other metric details.
In the experiment explore section, Statsig calculates a new adjusted based on your selections, and the confidence intervals use (1 - adjusted ).
Was this helpful?