For AI agents: a documentation index is available at /llms.txt. Append .md to any page URL for markdown, or send Accept: text/markdown.
Differential Impact Detection
Learn how Statsig automatically flags experiments with extreme differential impacts on sub-populations.
Differential Impact Detection flags an experiment when its effect on one configured user segment, such as a browser, operating system, or country, differs sharply from its effect on all other users. Experiments can affect sub-populations in ways the topline result hides: a bug might affect only one browser, or a segment's lift might cancel out against other changes. Statsig analyzes experiments for differential impact when Pulse loads after Day 1, after Day 3, and when the experiment reaches its Target Duration, and it flags extreme differential impacts for any segment you configure. This feature is also called Heterogeneous Treatment Effect or Segments of Interest.
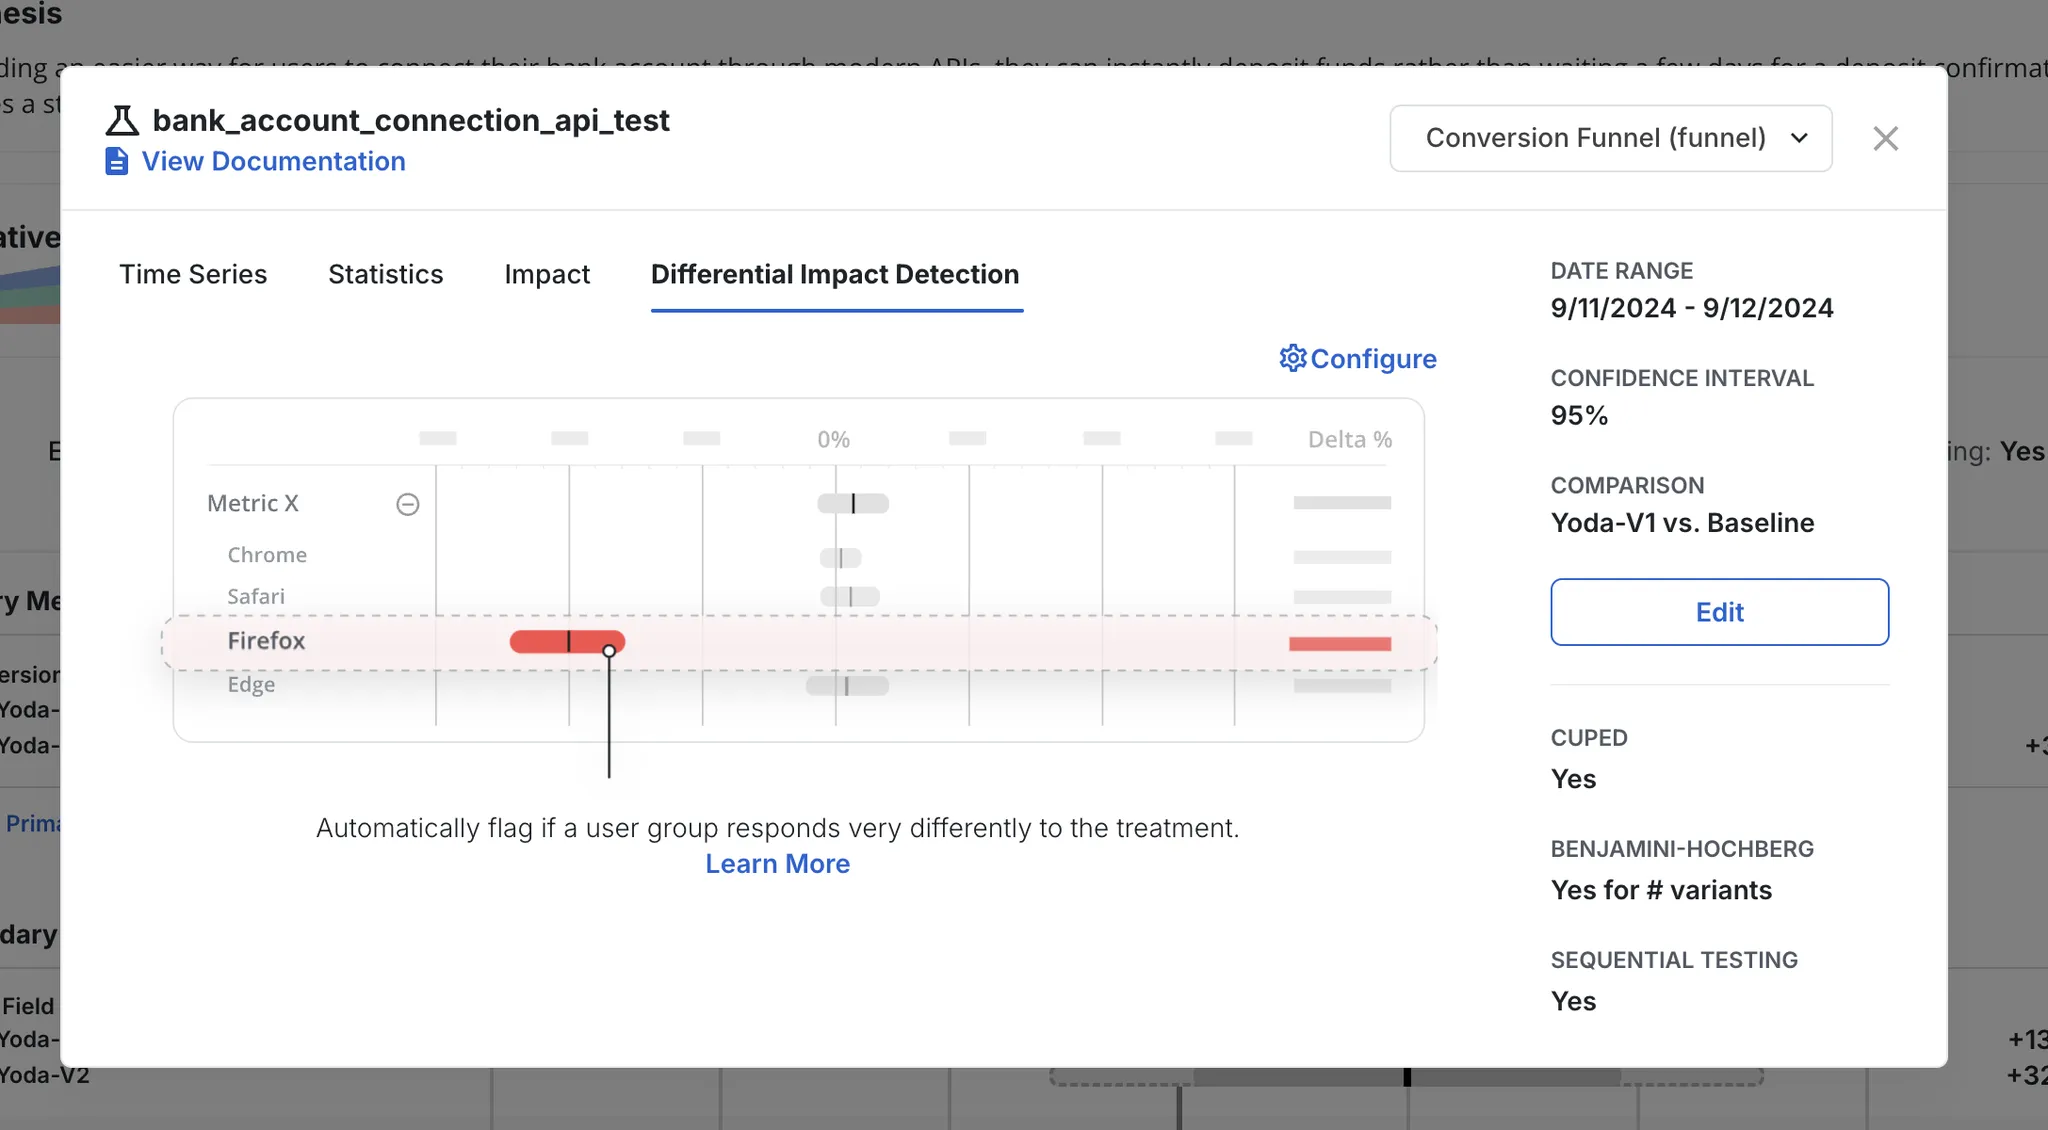
Configure segments of interest
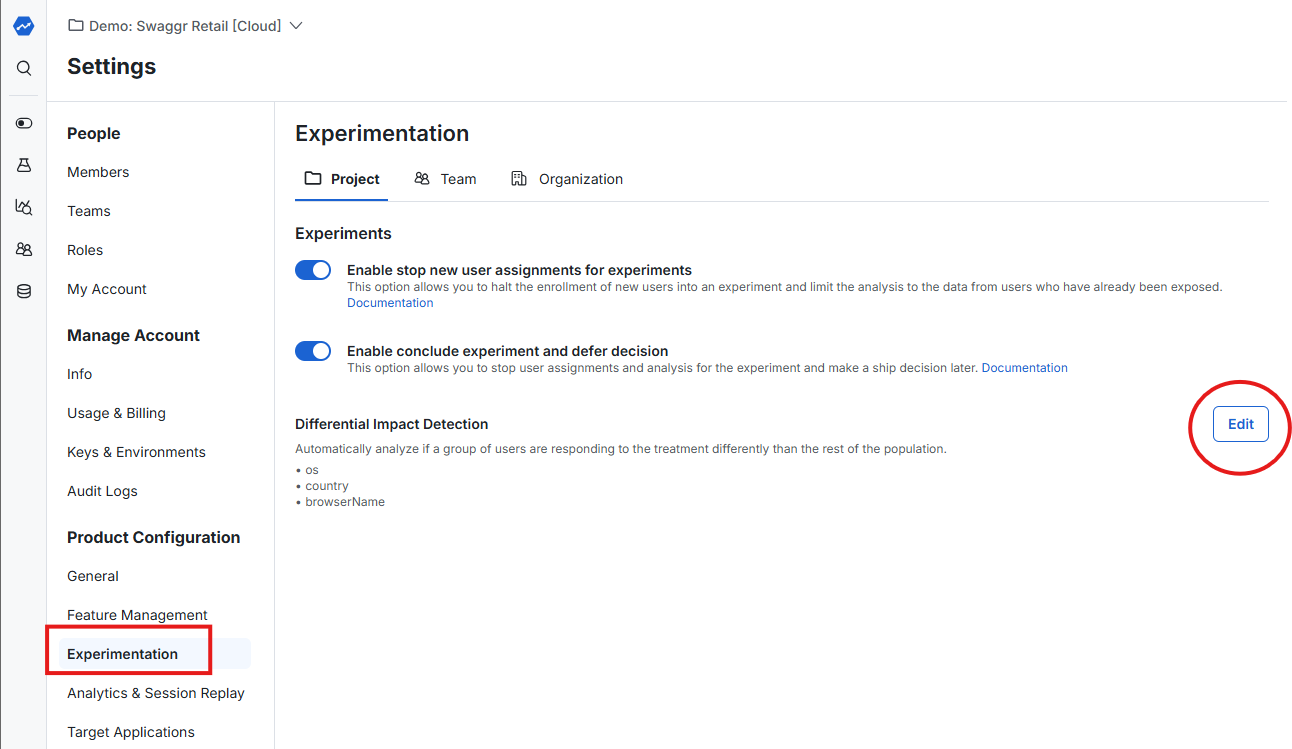
Configure the Segments of Interest that Statsig evaluates for Differential Impact Detection. On Statsig Cloud, segments are user properties in the User Object that you set when you use the Statsig SDK. On Statsig Warehouse Native, you can also configure segments as an Entity Property.
How Statsig flags differential impacts
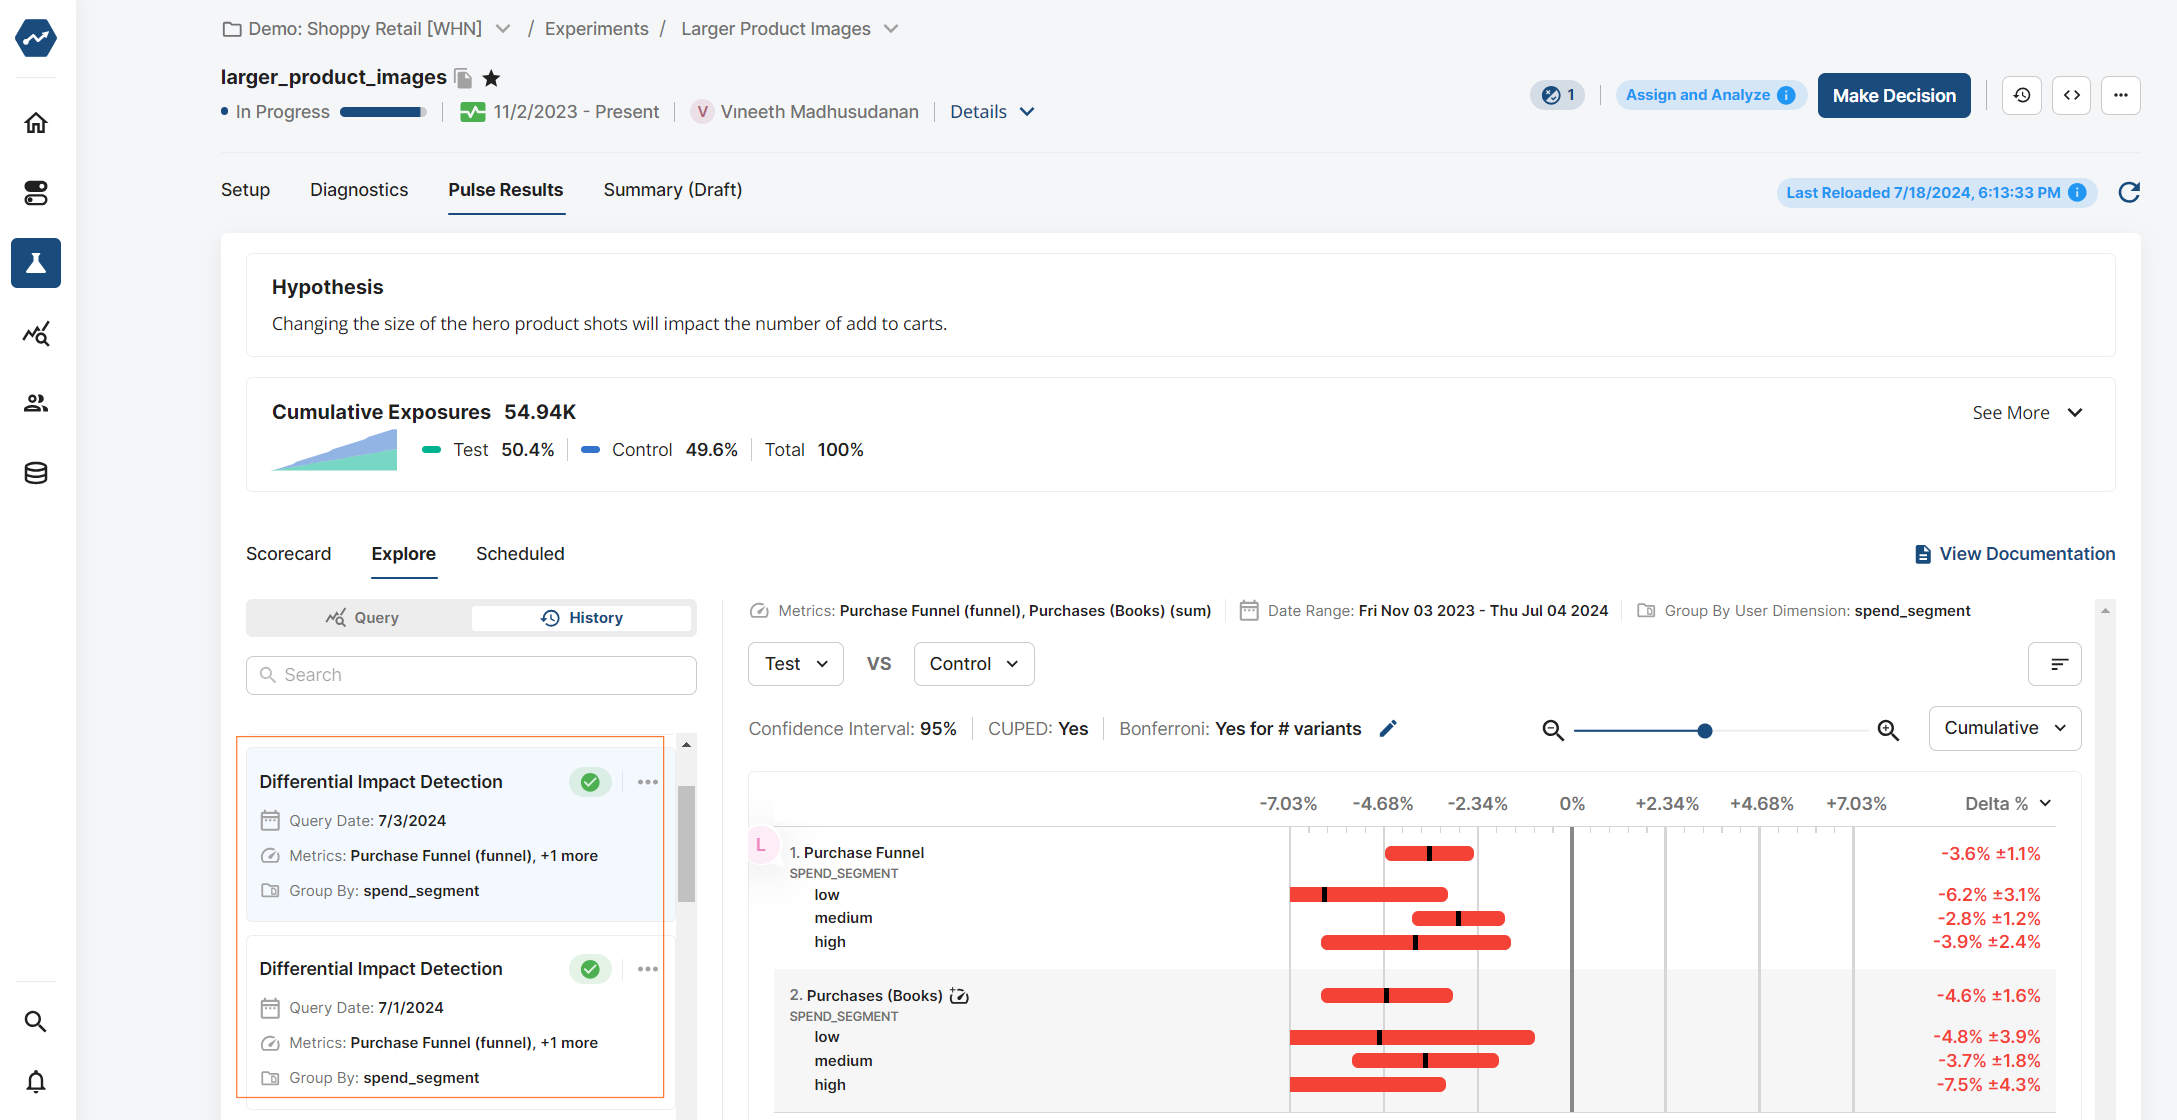
If Statsig finds extreme outliers for a segment you configured, it flags the experiment when you view Pulse results. The Explore section of your Pulse results shows the data broken out by segment.
Methodology
Statsig uses a Welch's t-test to compare the treatment effect for one segment of users with the treatment effect for all other users. Welch's t-test suits this comparison because user segments can have unequal population variances.
Statsig calculates the average treatment effect as follows:
Statsig calculates the variance in treatment effect as follows:
Statsig calculates the n of the treatment effect as follows:
With these values, Statsig determines the t-statistic and degrees of freedom as it does for any experiment that uses Welch's t-test.
Statsig then applies a Bonferroni Correction to adjust alpha and avoid false positives. The correction sets two thresholds: a high likelihood of heterogeneous treatment effect and some likelihood of heterogeneous treatment effect. For the Bonferroni Correction, one "comparison" is the calculation of one dimension against the rest, for one metric, for one test variant against control.
View historical differential impact analyses
To view all historical analyses, go to the Explore tab of your experiment and filter to the Differential Impact Detection query type.
Was this helpful?