Metrics Overview
Configure metrics in Statsig Warehouse Native using metric sources, including aggregation types, rollups, filters, and metric directionality.
Metrics are measures of user or system behavior that serve as evaluation criteria for experiments and for performing analysis.
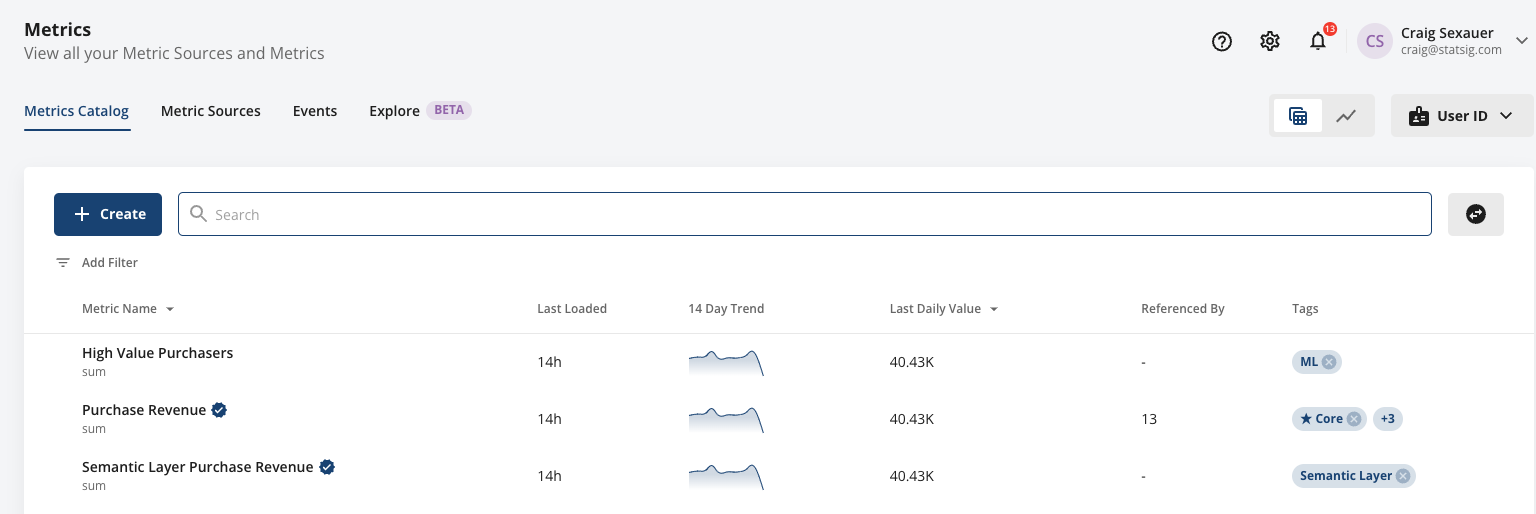
Metrics are organized within your Metrics Catalog.
Creating metrics
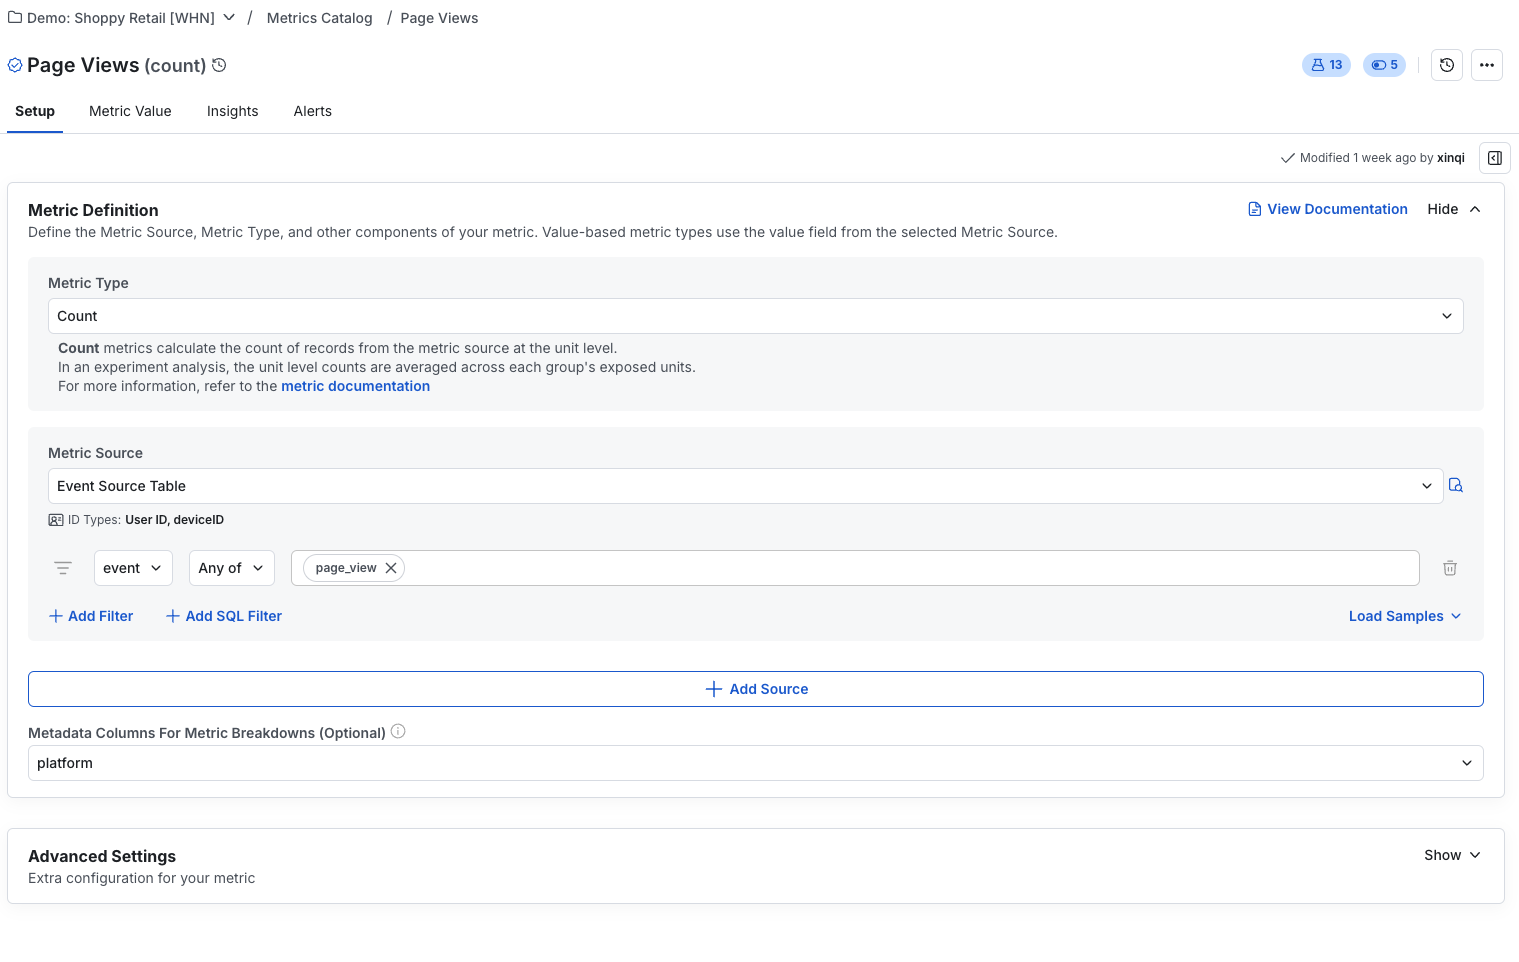
Metrics are a combination of a metric source, an aggregation, and optional filters and advanced settings. The metric source provides the raw data, and the aggregation defines how Statsig aggregates data across different granularities: user-level, group-level, or daily timeseries.
Metrics can support multiple units of analysis. For example, you can use a revenue metric for a "User Level" and a "Store Level" experiment, as long as the metric source has a mapping for both ID types.
Filters are also a core component of metrics. Statsig offers a rich set of filtering options, including SQL-based filters, so you can reuse the same metric source for many use cases.
Using metrics
You can use metrics for standalone analysis, as part of your experiment scorecard, or as guardrails for feature releases. You can also group them into collections using tags for easy addition across these surfaces. You can also configure metrics to send alerts globally if any experiment or gate causes a regression.
Statsig recommends using tags extensively. A combination of team-level and surface- or product-level tags ensures easy discovery of metrics.
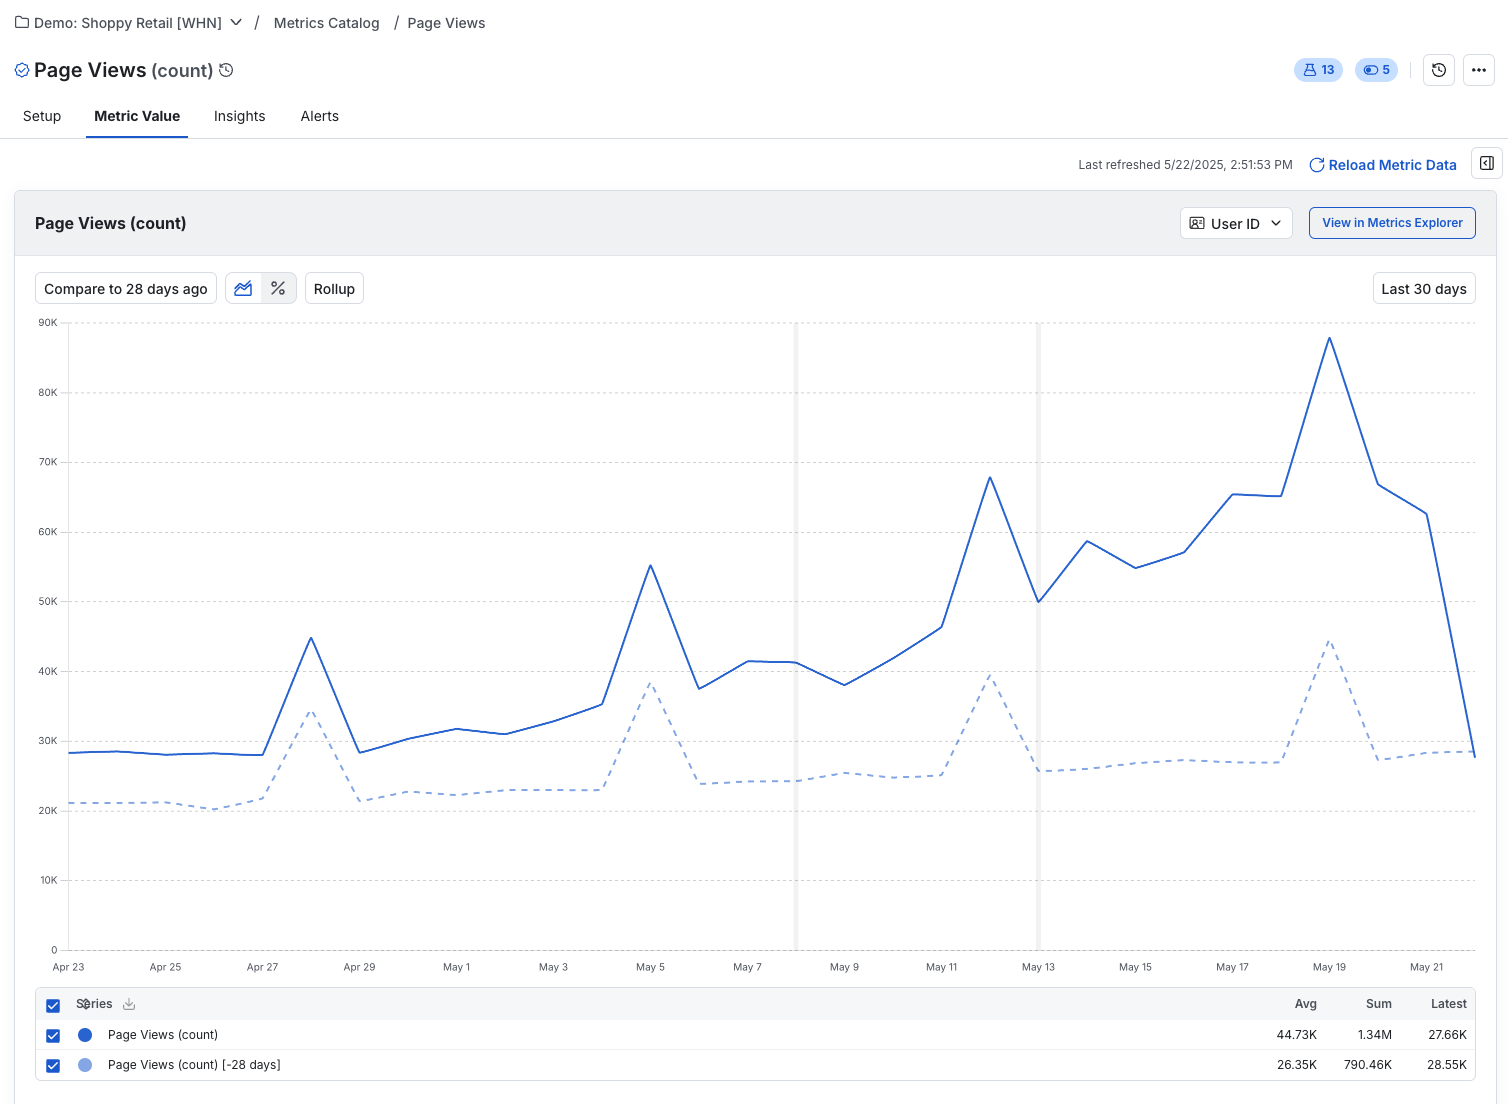
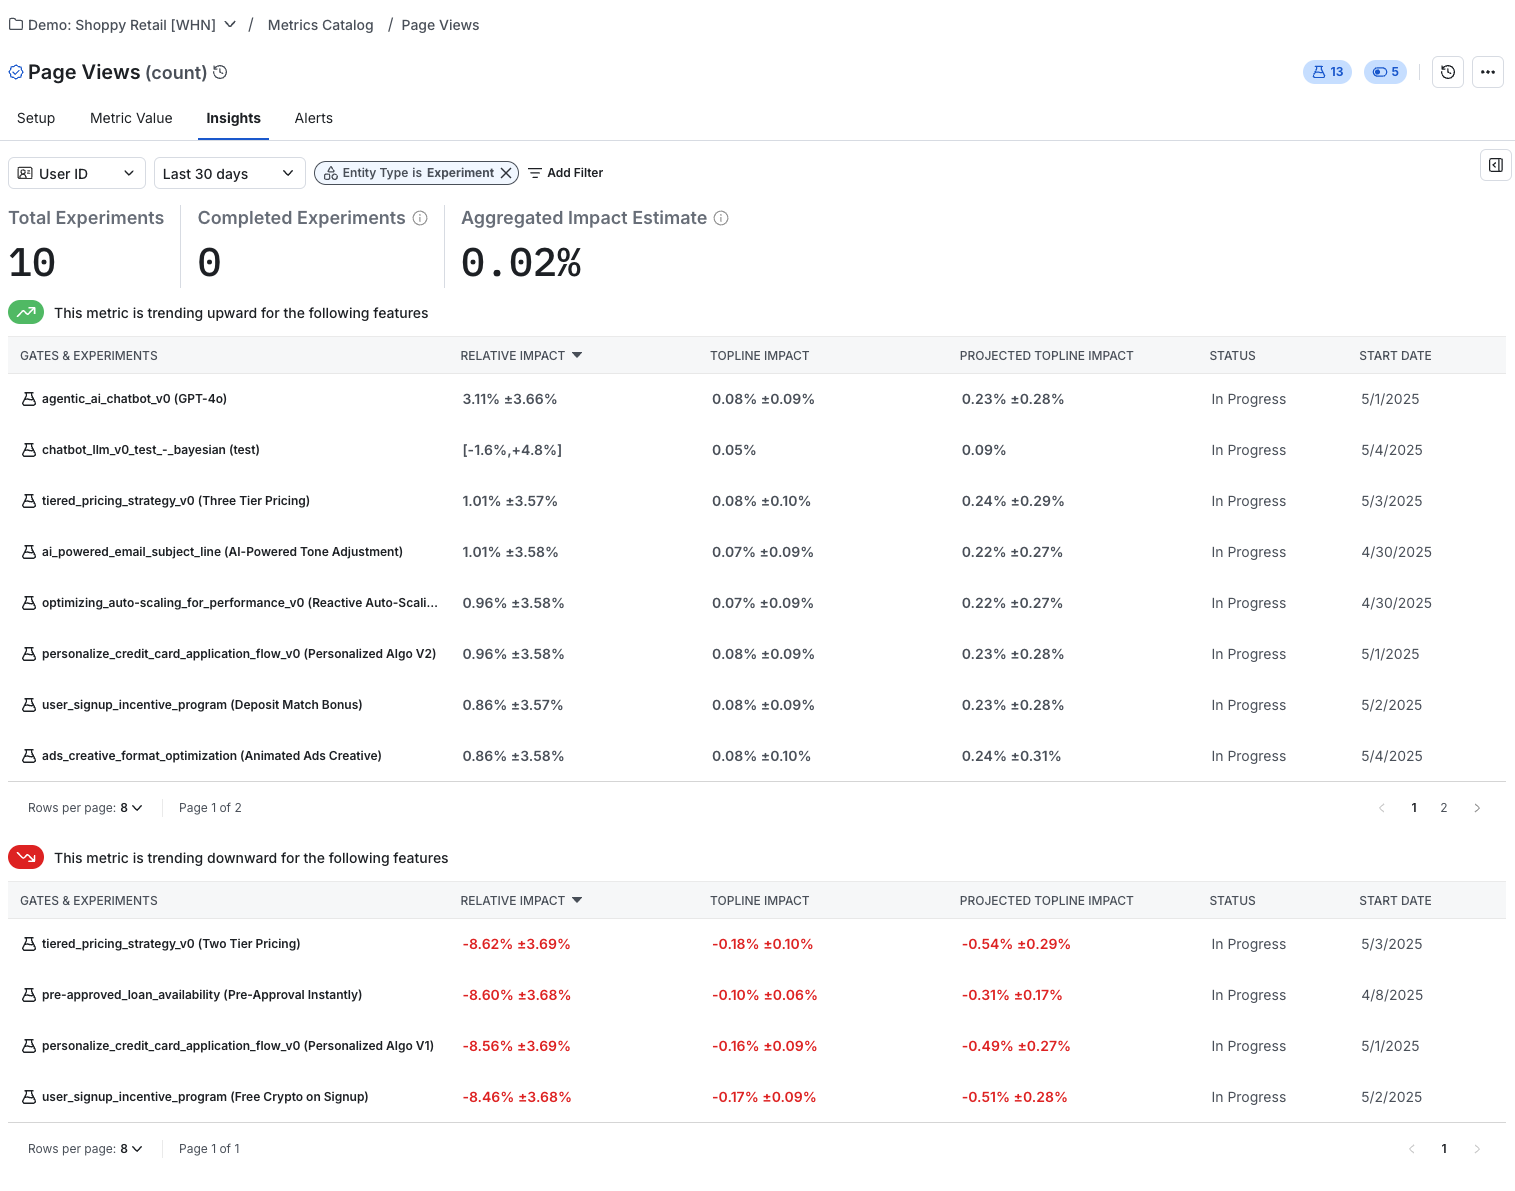
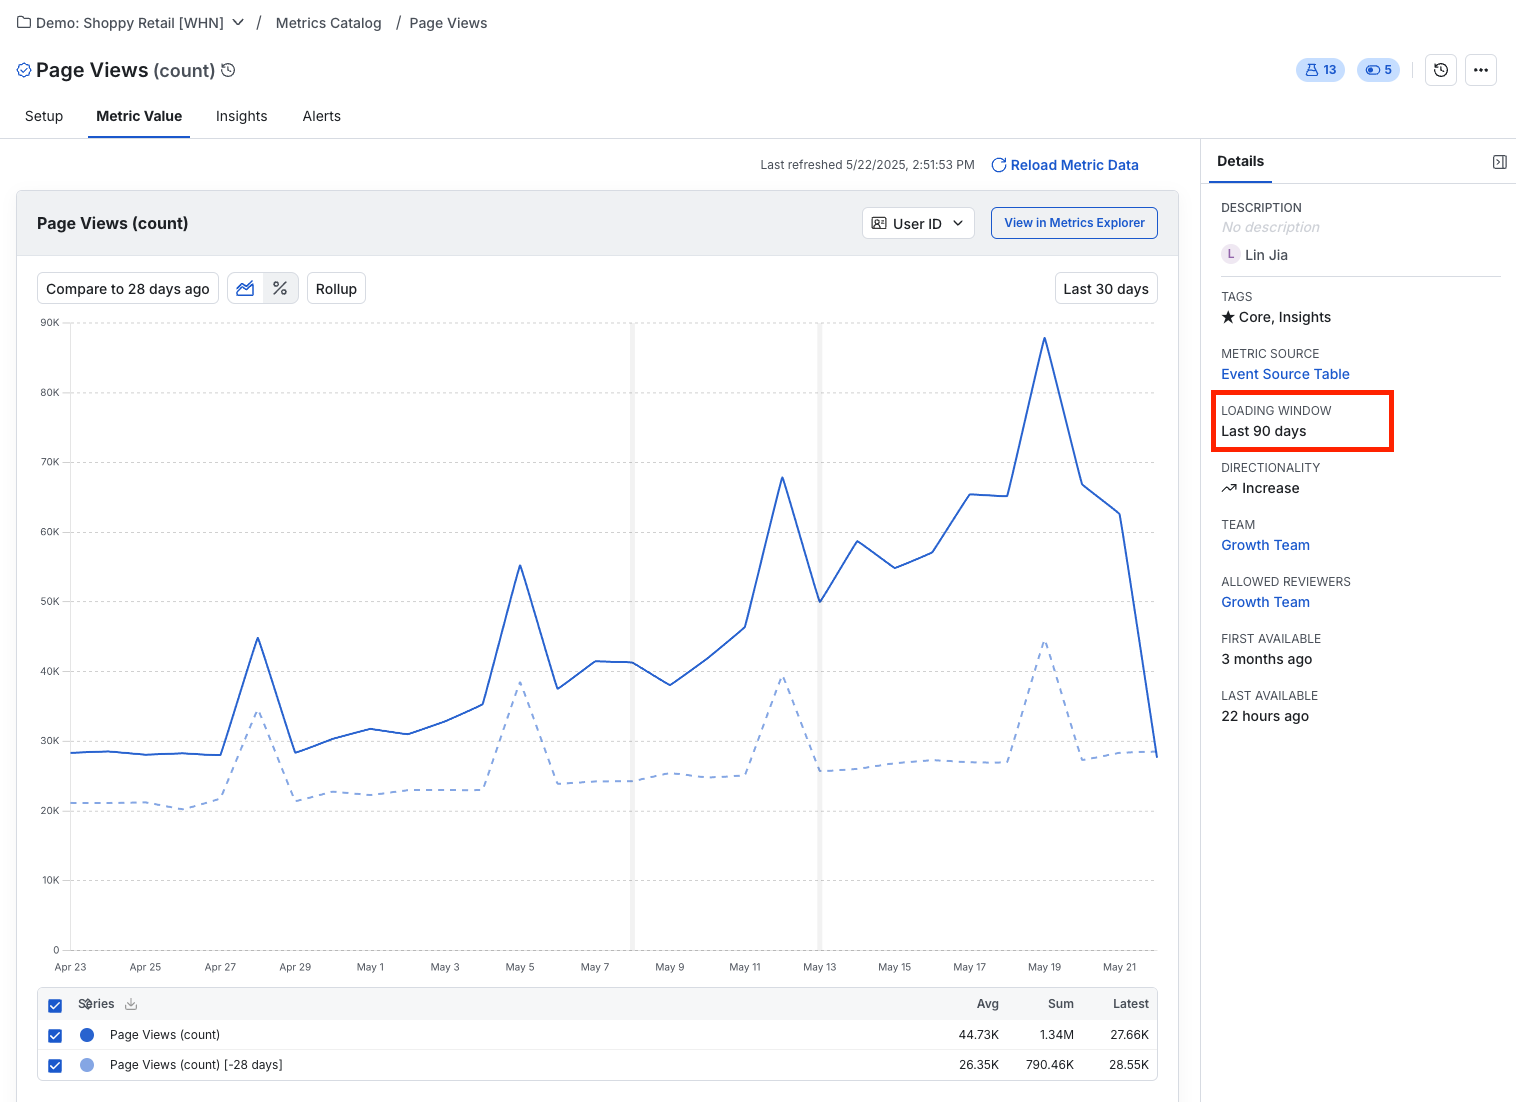
To view details about a metric, navigate to the Metrics page to see its definition, related experiments, and a timeseries of the metric value.
Loading metrics
Selecting Reload Metric Data causes Statsig to sync your latest data and display it on this page. The default loading window is 90 days, but you can configure a longer period if needed.
To use metrics to measure topline impact, or for ongoing tracking in the metrics page, schedule loads of the metric values. You can trigger a load manually from the metric page, or schedule it from there (3-dot menu > edit scheduled reload). You can also configure this as a project-level setting under Data Connection in your project settings.
Metric management
Without a well-managed Metric Catalog, end users may not know whether they can trust a metric or understand how it's defined. Statsig provides several tools to address this:
- [Verified Metrics] and programmatic management allow you to vet your core metrics and make it clear which metrics set the gold standard
- [RBAC and Team Ownership] let you limit the number of potential editors for Metrics, keeping control of core definitions in the experiment team's hands
- [Local Metrics] in Pulse or Explore queries allow you to make experiment-scoped and clearly-labeled changes to metric definitions without adding a large amount of single-user metrics to your metrics catalog
- Scorecard hover-over definitions make it trivial to discover, in-context, what settings were applied to a metric and how the calculation was performed.
Metric types
Statsig offers the largest coverage of metric types of any enterprise platform. These fall into 4 categories:
Aggregations
Aggregations are basic unit-level counts or sums that measure user behavior. You can use them as inputs to ratios, especially for cluster-based experiments where you want to normalize measures.Statsig computes aggregations at the unit level, then averages them across all units in the experiment during Pulse analysis.
Supported aggregations are:
- Count
- Sum
- Logged Sums and Counts
- Count Distinct
- First Value
- Latest Value
- Thresholds
- A special case of sum/count that measures a 1/0 flag for whether a user passed a threshold value during the experiment - e.g., "the number of users who spent more than $100"
Unit counts, retention, and conversion
Statsig offers many ways to count units in an experiment. This allows you to measure questions like:
- Did users sign up more often?
- Are more users currently subscribers at the end of the experiment?
- How many users refunded in the first week of the experiment?
These all fall under the "Unit Count" type, with rollups specifying calculation details. Unit counts produce a 1/0 flag or a sum of user-days at the user level, then Statsig averages them across all units in the experiment during Pulse analysis.
Supported unit count types are:
- One-Time Event, measuring if a user performed an action at all during the experiment
- Windowed, measuring if a user performed an action within some time window after exposure
- Latest Participation, measuring if a user fulfilled some criteria on their latest recorded record (e.g. is this user currently a subscriber)
- Daily Participation, the rate at which units were daily active users during the experiment
- Retention, the rolling rate of retention on an action or set of actions with a configurable time window
Ratios and funnels
Ratios and funnels measure rates or conversion. Statsig aggregates these differently: they measure the total of a numerator metric divided by the total of a denominator metric across each experiment group. They also apply the delta method to correct for covariance between the component metrics.
Ratio Metrics allow you to measure ratios of two different metrics, giving nuance to results and helping you to normalize results by another measure - for example:- B2C: Average purchase revenue (
SUM(Revenue) / COUNT(orders)) - B2B: Revenue per User (
SUM(Revenue) / COUNT_DISTINCT(user_id))
Performance metrics
Teams working on performance problems use Statsig to analyze the impact of their changes at a system level. These metric types can also be useful for user behavior. The types most commonly used here are:
- Percentile Metrics allow you to measure changes in values like the P99.9 - useful for measuring improvements or regressions in latency, TTL, or measuring median change when the mean is skewed
- Mean Metrics are an easy shorthand for ratio metrics summing an event-level value and dividing by the total records
Filters
Statsig offers many ways to filter your data. You can write filters in SQL, but leaving metric sources broad and allowing users to construct filters in the UI or through semantic layer syncs gives greater no-code flexibility for metric creation and follow-up analysis, especially when using local metrics.Any of / None of
These are the equivalent to a SQL IN or NOT IN statement, and you can also use them for equality/inequality. You can supply 1 to N values to the filter to include or exclude from your result set.
Inequalities
You can compare numerical values using =, >, <, >=, or <=. Equality can also compare non-numerical values, which Statsig evaluates as a string-casted comparison.
Null checks
Statsig supports checks for Is Null or Non Null, which can be useful for identifying if a flag was logged or for filtering out partial data.
Contains/Does Not Contain/Starts With/Ends With
These operators are similar to a SQL LIKE operator:
- Contains checks for if a substring is in a string, e.g. `field LIKE '%search_string%'
- Does Not Contain checks for if a substring is in a string, e.g. `field not LIKE '%search_string%'
- Starts With checks for if a substring starts the field, e.g. `field LIKE 'search_string%'
- Ends With checks for if a substring ends the field, e.g. `field LIKE '%search_string'
Is After Exposure
This filter allows you to specify a secondary date/timestamp field that has to come after the user's enrollment to the experiment.
By default, Statsig only considers metric data where the primary metric timestamp is after the user first saw the experimental intervention. However, you might have another field like "first_saw_content_at". You can use Is After Exposure to enforce that this secondary timestamp also takes place after the user's exposure.
SQL filters
SQL filters allow you to inject any SQL filter string into your metric definition, which Statsig validates before saving. This is flexible and lets you interact with complex objects or do complex logic operations as needed to define your metrics.
For example, the sql filter (weight_lb)/pow(height_inches, 2) > 25 would be added to your metric source query for this metric as:
  SELECT
    <columns>
  FROM <source_table>
  WHERE <other_filters> AND ((weight_lb)/pow(height_inches, 2) > 25)
Settings
Each metric type's page has specific information on settings relevant to that metric. This section introduces common settings across metrics.
Breakdowns
Most aggregation-type metrics (sum, count, count distinct, unit count, means, ratios, percentiles, first/latest, min, max) allow you to generate a breakdown view of any column automatically. You can specify this column in the metric set up, and then click into the experiment result to see the breakdown.
Cohorts
Cohort settings allow you to specify a window for data collection after a unit's exposure. For example, a 4-6 day cohort window would only count actions from days 4, 5, and 6 after a unit was exposed to an experiment.
Refer to the cohort documentation for full details.Baking
Many metric types support baking. Statsig waits to calculate baked metrics and uses "old" data for them. This is appropriate for cases like credit card chargebacks, where you may adjust your payments dataset to account for chargebacks in a "net revenue" metric. For additional information, go to the cohort documentation.Statsig:
- doesn't calculate baked metrics until the bake period has elapsed since the user's enrollment
- pulls historical data that "just baked" as of that day on a given load
- only calculates results for users whose bake window has elapsed to avoid diluting metrics
This way, Statsig doesn't show incomplete data in Pulse (either because it is incomplete in the warehouse, or because of late-landing data).
Thresholding
Thresholding converts a sum, count, count-distinct, max/min, or first/latest metric into a 1/0 unit metric based on whether a user's total value meets a specified threshold. For example, to measure how many users spent at least $100 in their first week, specify a 0-6 day cohort metric that sums revenue with a threshold of $100.
CUPED
You can enable/disable CUPED per metric, and also specify the lookback window for which Statsig pulls users' pre-exposure data and uses it as an input to the CUPED regression.
Winsorization
Go to winsorization for full details. Winsorization applies to aggregate metrics and allows you to specify an upper or lower percentile-based threshold, clamping data to that threshold. This reduces inflated variance or skewed means caused by outlier data or buggy logging.Capping
Capping is an alternate outlier-control method that clamps values to a unit-day cap, specifiable per unit type. For example, you might clamp "total purchase count" to 100 on an auction platform to prevent resellers from skewing your metrics, assuming 100 is a reasonable upper bound for typical users.
Was this helpful?