For AI agents: a documentation index is available at /llms.txt. Append .md to any page URL for markdown, or send Accept: text/markdown.
Managing SRM
How Statsig detects and surfaces sample ratio mismatch (SRM) in experiments and how to debug skewed traffic splits before trusting results.
Sample ratio mismatch (SRM) means the number of units in each experiment group differs from your configured split by more than randomness explains. Statsig runs a chi-squared test on exposures and shows SRM in the experiment's health checks as a warning or an alert. Treat a persistent alert as a data-quality problem: the groups are no longer comparable, so you can't trust metric lifts until you find the cause or restart the experiment.
What SRM looks like
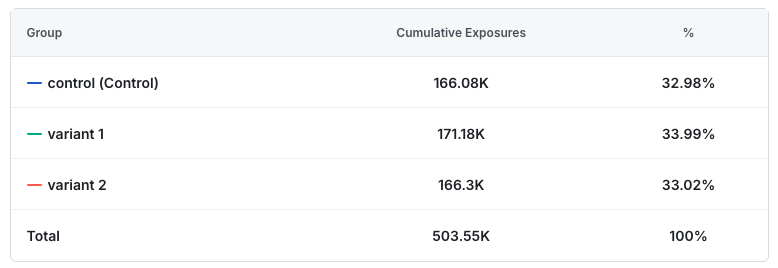
The following exposure crosstab shows an experiment with SRM. The group percentages look similar. However, if an assignment system splits traffic evenly, an imbalance this extreme or greater has less than a 0.01% chance of occurring randomly.
Statsig and most experiment platforms normalize metrics per user: they measure a count metric as total count divided by unique users in the experiment. In isolation, having more users in one group isn't a problem.
Why SRM biases results
SRM is usually non-random: the extra or missing traffic isn't identical to the original traffic. Common causes of SRM include:
- A bug causes a user's client or browser to crash before it can send an exposure log. Statsig doesn't re-expose users who don't return, but includes users who return. This introduces bias in measurement.
- A conditional dependency filters which users Statsig exposes based on some characteristic for one or more groups, which makes those groups non-identical to other groups and biases measurement.
- A script bulk-exposes users one group at a time, and the system truncates logs after a certain count, which cuts off the last group's exposures.
SRM checks detect these effects even at low rates, and even low-rate SRM can lead to inaccurate experiment readouts.
How Statsig detects SRM
Statsig detects SRM with a chi-squared test, which determines whether observed frequencies match expected frequencies. In the crosstab example on this page, the expected distribution is 167.85k units per group, but the observed counts are 166.08k, 171.18k, and 166.30k.
A low p-value rejects the null hypothesis that the groups are identical and indicates a difference between the groups' observed and expected assignment rates.
What to do if an experiment has SRM
When Statsig detects SRM, it sets the experiment's health check to a warning or failure state, depending on how extreme the SRM is. For the p-value thresholds behind each state, go to Monitor an experiment.
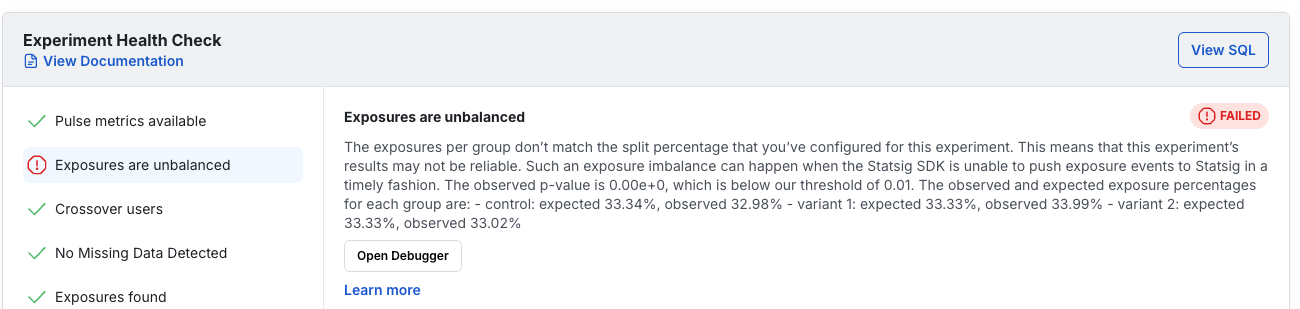
Teams often hesitate to reset an experiment and lose collected data, and an underlying issue may reproduce after a reset. Follow these steps to diagnose and address SRM.
Check the time series data
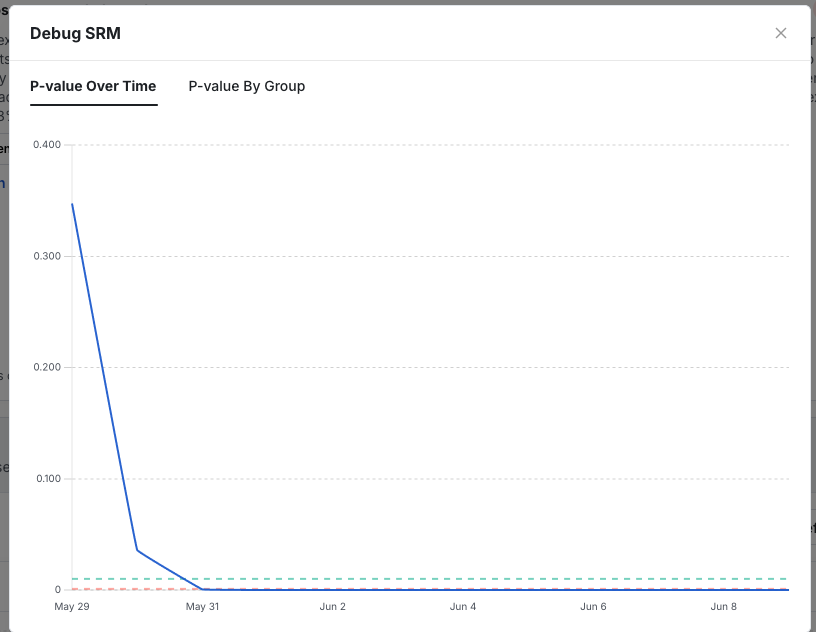
Statsig generates a chart of the SRM p-value over time. If the chart is noisy and fluctuates, the alert is more likely a false positive. If the p-value consistently trends down to 0, a real assignment issue is likely.
The following p-value chart indicates a real issue.
Look for a clear root cause
Use Statsig's SRM debugger or analyze exported exposures to determine whether a specific segment drives the SRM. Often a bug affects only one platform, such as Android, or only users with slow internet connections. If you find and fix the bug, you can restart the experiment safely.
If the experiment was expensive or required a long data collection period, and the issue is clearly isolated to one segment, you can instead filter that segment out of the analysis.
Decide how to proceed
In most cases, the best path is to investigate, fix, and restart the experiment. Statsig recommends against proceeding without investigation and considers restarting the experiment a best practice, ideally after you investigate any potential SRM cause. If the SRM is mild enough, and the experiment low-risk enough, you may accept a decision based on the affected data.
Was this helpful?