Funnel Metrics
Use funnel metrics to understand user journeys
Funnel metrics are highly customizable in Statsig Warehouse Native. You can set up a user journey and understand how your changes influence each step at the user level or at the session level.
Creating a Funnel Metric
To create a funnel metric, configure the steps in order. For example, if you're running a property booking app with the following checkout flow:
- User Views a Property
- User Clicks Reserve for a Property
- User Pays for Property
- User Stays at Property Without Cancellation
Your metric setup page might look like this:
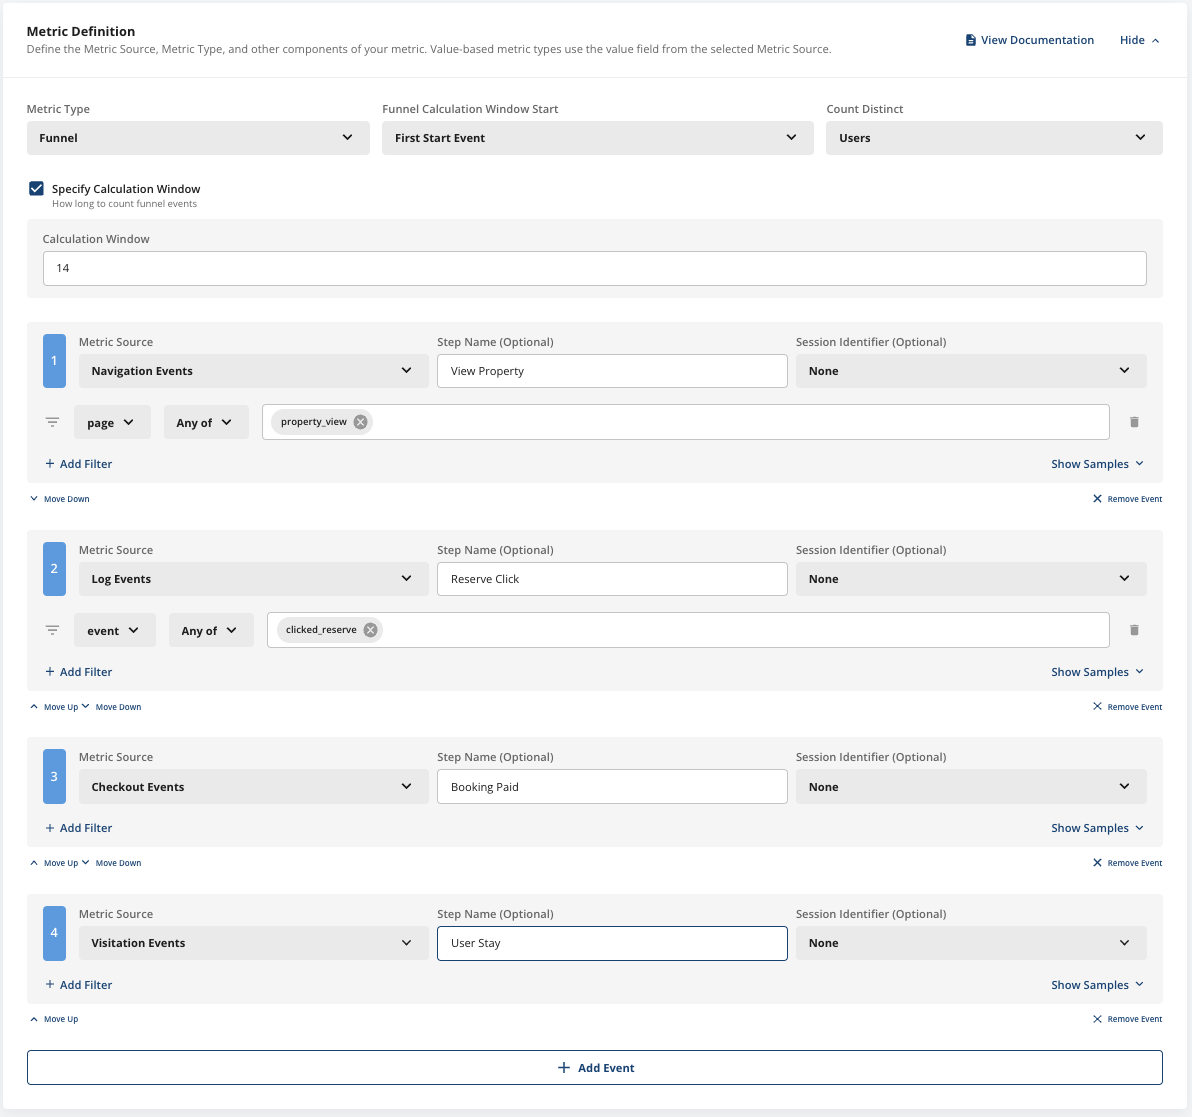
The funnel analysis counts each step only if all preceding steps occurred for that user in the correct order. You can add names for each funnel step to clarify the meaning, and you can pull from multiple data sources as long as they share a common user identifier.
Readouts
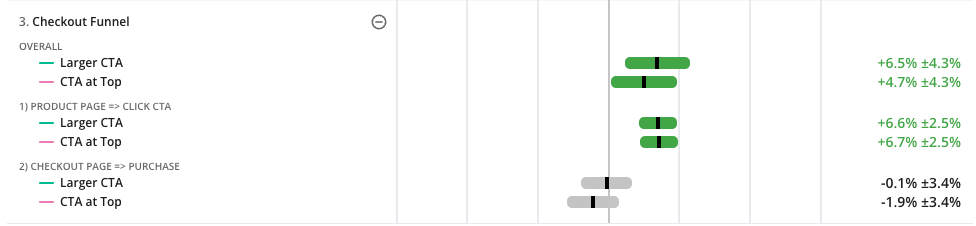
When you analyze an experiment with a funnel metric, you see the overall conversion impact for the funnel as well as step-wise conversion rate changes. This helps you understand where gains in a funnel come from, and whether increased conversion in one step leads to lower conversion further down.
- Overall Results: The "OVERALL" metric represents the number of users that entered the funnel (by viewing a "Product Page") and fully completed it (by converting on the final event, "Purchase").
- Stepwise Results: Each subsequent step in the funnel appears as prior step => next step. For example, the final step checkout page => purchase shows how many users that visited the checkout page proceeded to purchase.
In the funnel metrics below, two test groups are both outperforming the control group. The increase was driven by higher conversion on the Call To Action button.
Options
Several options are available for customizing funnels:
Sessions
Specifying a sessionID allows you to constrain funnel analyses to the same session or secondary identifier.
For example, you might want to count the funnel as a success only if the user checked out on the same property they initially viewed. This is a common use case for e-commerce flows. In this case, add a property identifier from the various data sources, and the funnel analysis calculates whether the user completed the funnel within a specific session.
Count Unique
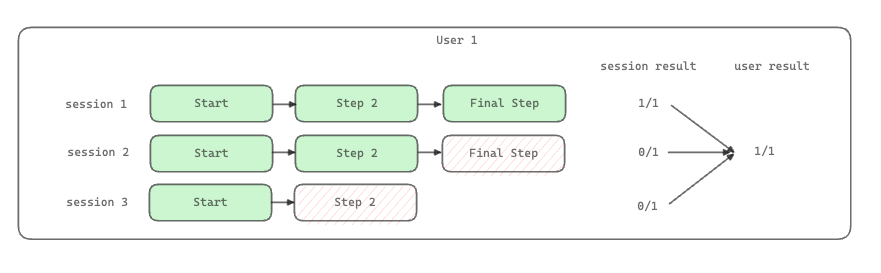
In Statsig Warehouse Native funnel analysis, you can measure the number of distinct users who completed each step in the funnel, or calculate session-level conversion.
If you have a Session identifier configured and choose user analysis, Statsig calculates the furthest progress in the funnel for each user. If you use session analysis, Statsig counts over each user's sessions.
Timeframes
You can choose an optional window in days from the user's exposure or from the funnel's first start event. Events that occur after this window don't contribute to the funnel analysis. This is useful when you want a defined bake window or when the flow has a finite duration, such as a subscription trial.
Custom Breakdowns
You can use Statsig funnel analysis with custom queries to see funnel results across user dimensions. This helps you understand which users respond best to changes and generate follow-up hypotheses to test.
Was this helpful?