Running an A/A Test
Learn how to run A/A tests to validate your experimentation setup and ensure proper metrics configuration.
An A/A test splits traffic into two groups that receive the same experience, so you can confirm that exposures flow into Statsig and that your metrics compute correctly before you run a real A/B test. Because neither group changes the product, the test is a low-stakes way to check your setup. Run an A/A test before your first A/B test, or after you change metric definitions. This tutorial creates and implements an A/A test as a feature gate in Statsig. Statsig also runs simulated A/A tests for you every day without any code on your side; use those results when you want to validate the stats engine itself rather than your instrumentation.
You need a Statsig account and the Statsig client SDK integrated into an existing application.
Step 1: Create a feature gate in the console
The easiest way to run an A/A test in Statsig is with a feature gate. You can also use an experiment, but this tutorial uses a feature gate.
Log into the Statsig console and select Feature Management > Feature Gates in the left-hand navigation panel.
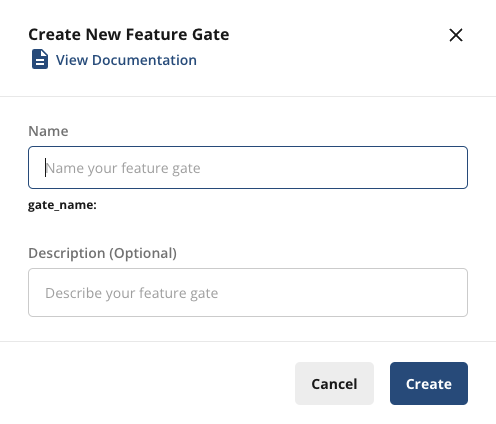
Click Create and enter a name and optional description for your feature gate. This example calls the feature gate aatest_example. Click Create.
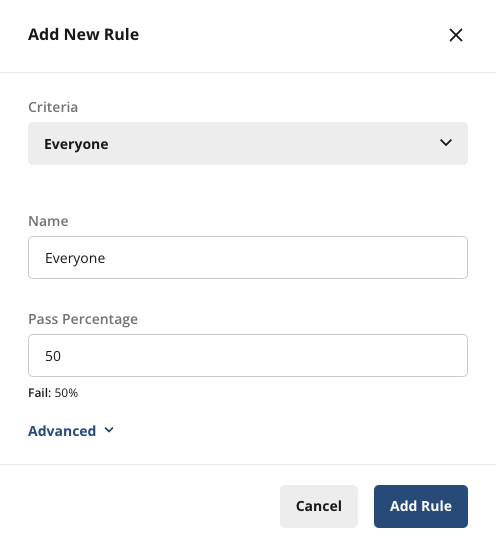
On the Setup tab, define the rules for this feature gate. Click Add New Rule. You can run an A/A test on a specific user group or platform, but this tutorial divides all traffic 50/50 and delivers the same experience to each group.
The new rule opens in the rules list. Name the rule, keep Criteria set to Everyone, and set Pass to 50%. Then save your changes at the bottom of the page, or submit them for review if your project requires reviews.
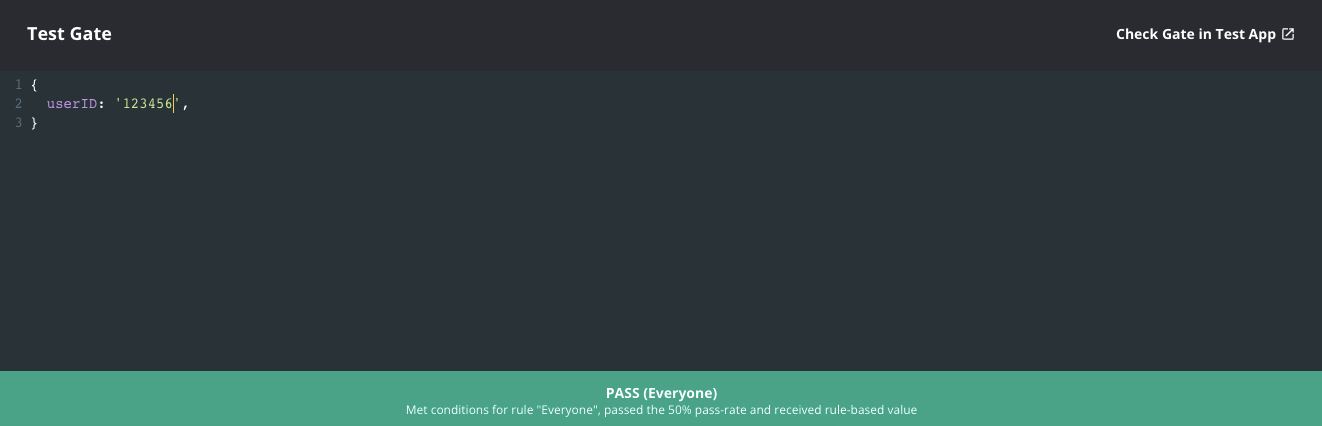
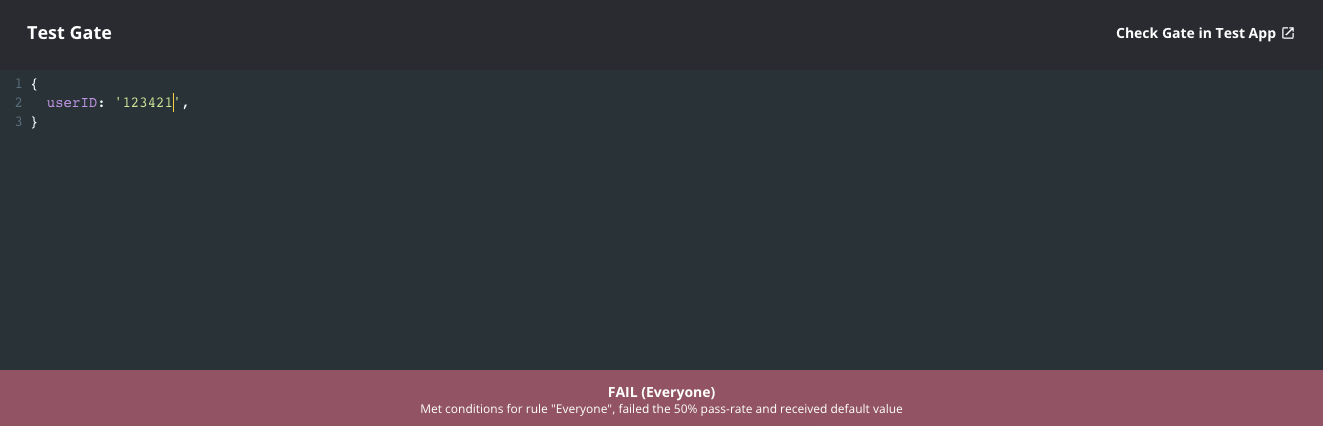
Verify that the gate works by entering some sample user IDs in the console. Roughly 50% of the IDs should pass and 50% should fail.
Step 2: Check the feature gate in your code
Copy the code snippet from the upper right corner of your feature gate page (under the < > symbol) and add it to your application at the point where you want to call the A/A check.
statsig.checkGate("aatest_example")
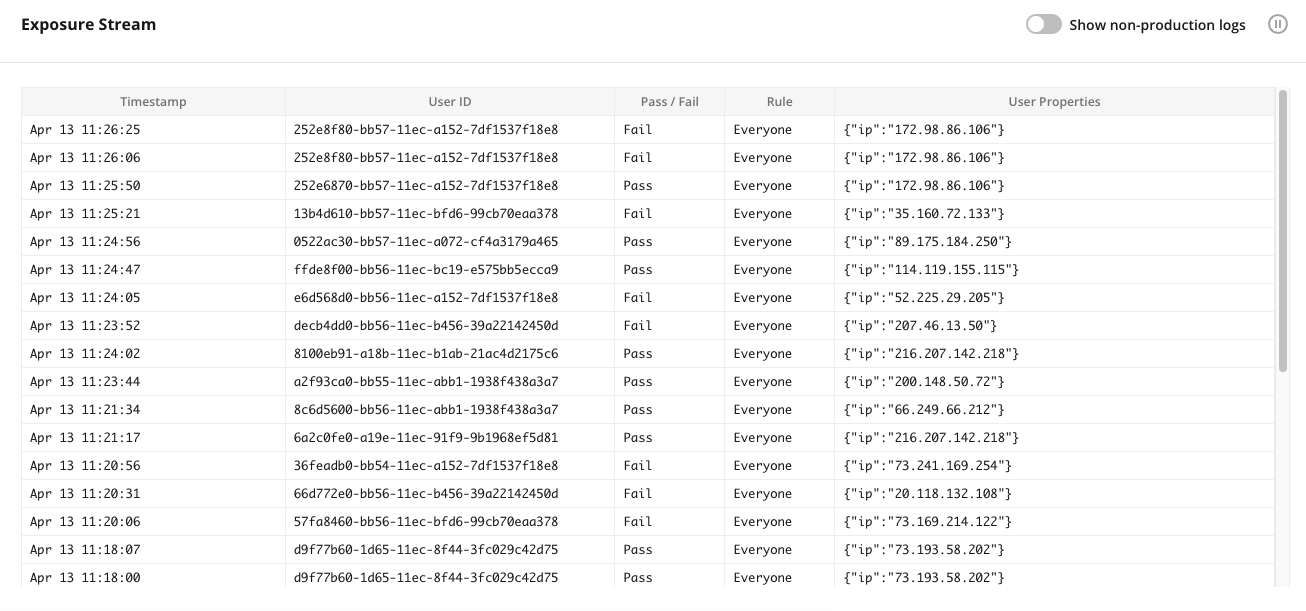
When a user renders this page in their client application, a live log stream appears in the Statsig console on the Diagnostics tab of your feature gate.
Step 3: Review A/A test results
Within 24 hours of the gate going live, cumulative exposures appear on the Metric Impact tab of your feature gate.
| Date | Fail | Pass |
|---|---|---|
| Mar 10, 2026 | 0 | 0 |
| Mar 11, 2026 | 0 | 0 |
| Mar 12, 2026 | 7,900 | 7,850 |
| Mar 13, 2026 | 8,723 | 8,668 |
| Mar 14, 2026 | 9,227 | 9,212 |
| Mar 15, 2026 | 9,740 | 9,740 |
| Mar 16, 2026 | 10,774 | 10,942 |
| Mar 17, 2026 | 11,771 | 12,006 |
| Mar 18, 2026 | 12,705 | 13,026 |
| Mar 19, 2026 | 13,567 | 13,947 |
| Mar 20, 2026 | 14,411 | 14,766 |
| Mar 21, 2026 | 14,922 | 15,265 |
| Mar 22, 2026 | 15,500 | 15,777 |
| Mar 23, 2026 | 16,637 | 16,925 |
| Mar 24, 2026 | 17,710 | 17,899 |
| Mar 25, 2026 | 18,685 | 18,880 |
| Mar 26, 2026 | 19,559 | 19,827 |
| Mar 27, 2026 | 20,461 | 20,641 |
| Mar 28, 2026 | 21,071 | 21,158 |
| Mar 29, 2026 | 21,661 | 21,643 |
| Mar 30, 2026 | 22,729 | 22,803 |
| Mar 31, 2026 | 23,637 | 23,760 |
| Apr 1, 2026 | 24,571 | 24,612 |
| Apr 2, 2026 | 25,505 | 25,590 |
| Apr 3, 2026 | 26,429 | 26,377 |
| Apr 4, 2026 | 27,030 | 26,898 |
| Apr 5, 2026 | 27,509 | 27,382 |
| Apr 6, 2026 | 28,519 | 28,484 |
| Apr 7, 2026 | 29,432 | 29,390 |
| Apr 8, 2026 | 30,305 | 30,204 |
| Apr 9, 2026 | 31,120 | 31,082 |
| Apr 10, 2026 | 31,995 | 31,905 |
| Apr 11, 2026 | 32,500 | 32,450 |
The Metric Impact tab shows your logged exposures and their distribution. In a healthy A/A test, Pass and Fail each hold close to 50% of exposures. If the distribution looks incorrect, check the Diagnostics tab for day-by-day exposure breakdowns at both the check and user level.
The Metric Lifts panel shows how all your tagged metrics perform.
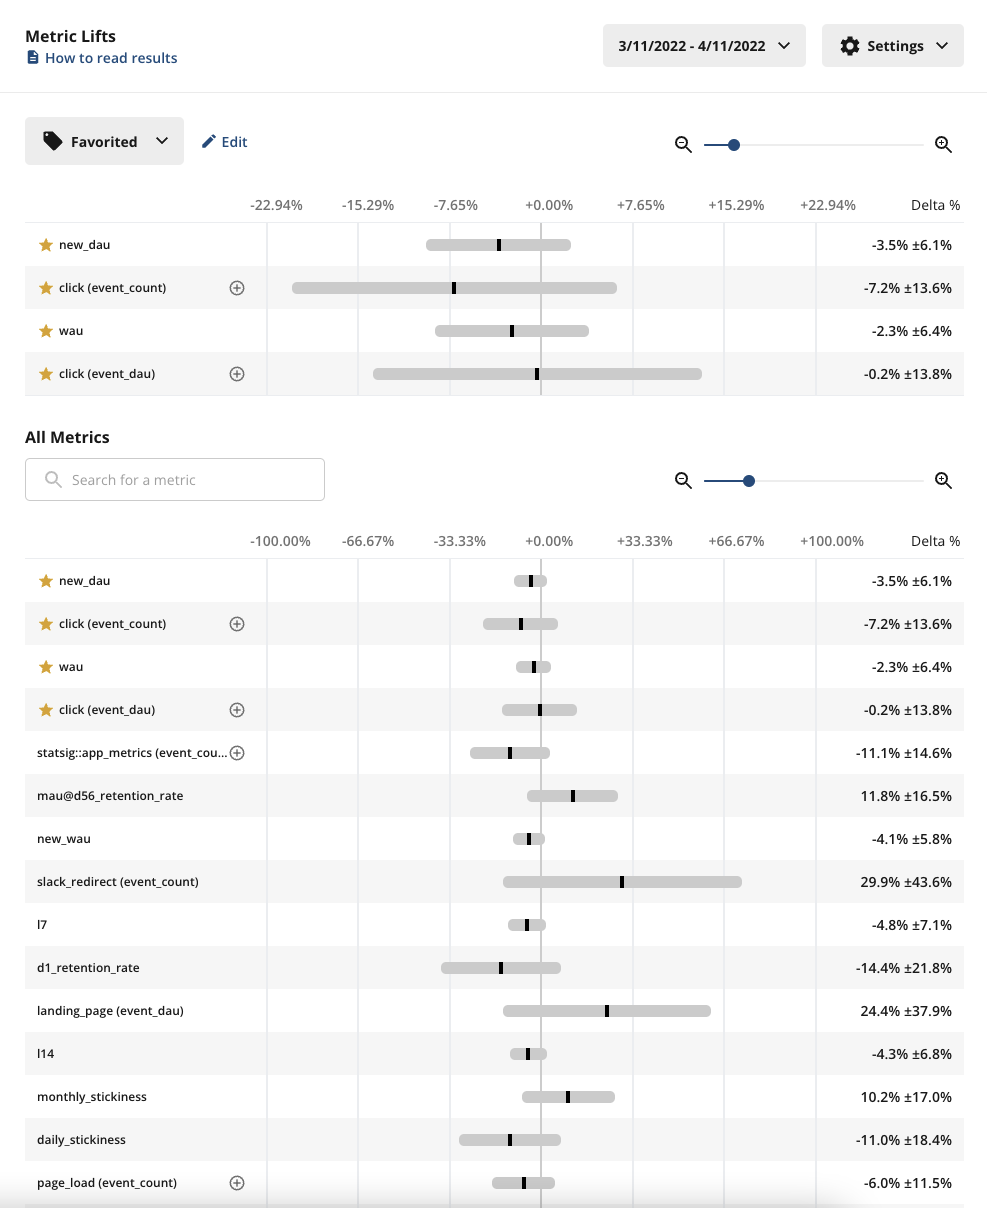
Check two things in the results:
- Exposures: Confirm that exposures flow through from your product as expected. If you don't see exposures, use the Diagnostics tab and the Exposure Stream to debug.
- Metric results: Roughly 5% of your metrics should show a statistically significant change, because Statsig's stats engine uses a 95% confidence interval.
Run your A/A test for at least a week, and long enough to reach most of your weekly active users.
Simulated A/A tests Statsig runs for you
Statsig runs simulated A/A tests every day in the background for every company on the platform. Like the test in this tutorial, a simulated A/A test has the structure of an A/B test, but both groups receive the same experience.
A/A tests can be online or offline. An online A/A test, like the one in this tutorial, runs on real users: your app checks a gate or experiment through the Statsig SDK, Statsig logs the assignment, and users see no difference in experience. Because there is no real effect, you expect to see only statistical noise. With 95% confidence intervals, only about 1 in 20 metrics shows a stat-sig difference between control and test.
Offline A/A tests
An offline A/A test runs on one unit type per request and works like this:
- Query a representative sample of your data.
- Randomly assign subjects to test or control.
- Compute the relevant metrics for test and control and run them through the stats engine.
- Measure the percentage of false positives. With a typical p-value cutoff of 0.05, expect a false positive rate of about 5%.
Statsig runs 100 tests per request. To export the running history of your simulated A/A test performance, open the Help menu (?) in the Statsig console navigation and select Automated A/A Testing. When the export finishes, download it from Settings > Reports, where it appears with the export type A/A Test Summary.
Simulated A/A test file columns
| Column name | Description |
|---|---|
metric_name | Name of the metric |
metric_type | Type of metric |
unit_type | The unit used to randomize (for example, userID) |
n_tests | The number of tests run |
pct_ss_95_pct_confidence | The percentage of tests that have a stat-sig result for this metric |
avg_units_per_test | The number of units (often users) sampled into the A/A test |
avg_participating_units_per_test | The number of units in the test with a value for this metric |
Was this helpful?
For AI agents: a documentation index is available at /llms.txt. Append .md to any page URL for markdown, or send Accept: text/markdown.