Pulse
Pulse is Statsig's visualization of how an experiment impacted target metrics. This page walks through the tool and how to use it to evaluate your experiment.
Pulse is Statsig's results view for an experiment, showing how each variant affected your target metrics. It's the default landing page for any experiment that has an analysis ready to view, and you can open it from within any experiment or gate.
Exposures
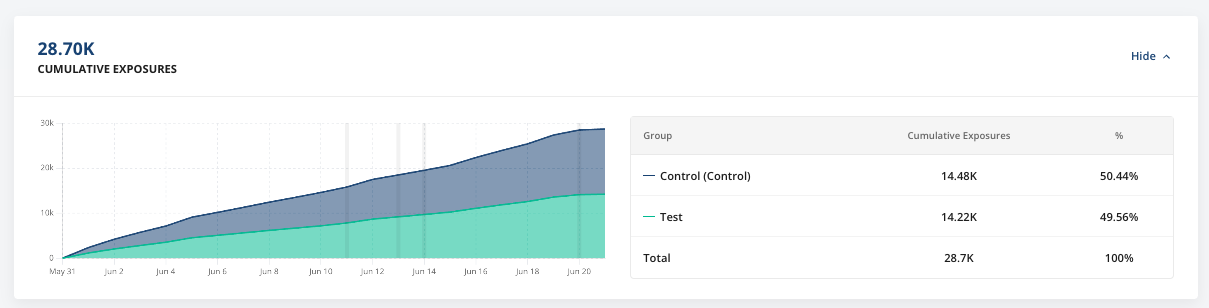
At the top of pulse is the exposures view. The exposures view shows how unique users have onboarded to an experiment over time. The view also shows the overall splits of users in the experiment.
In the health checks, an SRM check flags if exposures are imbalanced in a significant way.
Scorecard
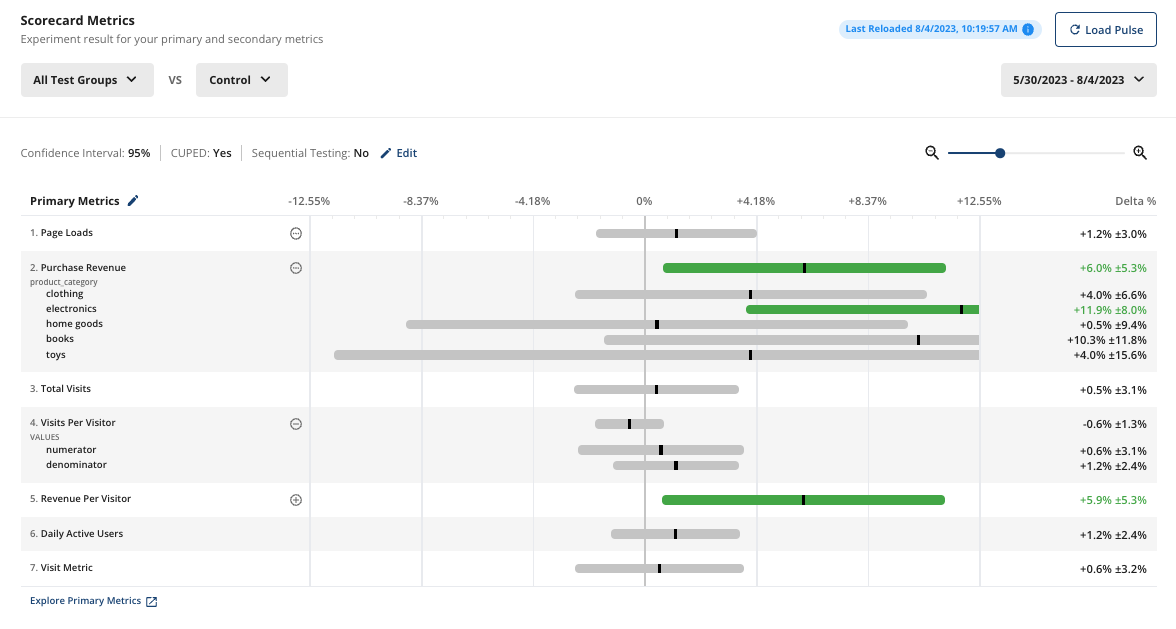
The scorecard is the core view of pulse.
For a detailed look at the stats engine, go to the stats engine docs.For every metric, Statsig shows you:
- The calculated relative difference (Delta %)
- The confidence interval
- Whether the result is statistically significant
- Positive lifts are green
- Negative lifts are red
- Non-significant results are grey
The formula for calculating lift is:
Delta(%) = (Test - Control) / Control
Statsig reports confidence intervals at the selected significance level (95% by default). In a typical two-sided Z-test, Statsig shows the confidence interval as +/- 1.96 * standard error.
Statsig applies Winsorization based on metric-level settings. Winsorization caps extreme outlier values to reduce their impact on experiment results. Statsig applies CUPED (regression adjustment) by default; toggle it off to view non-CUPED results. The settings page offers sequential testing, Bonferroni corrections for multiple comparisons, family-wise error rate control, and Bayesian analysis.
Health Checks
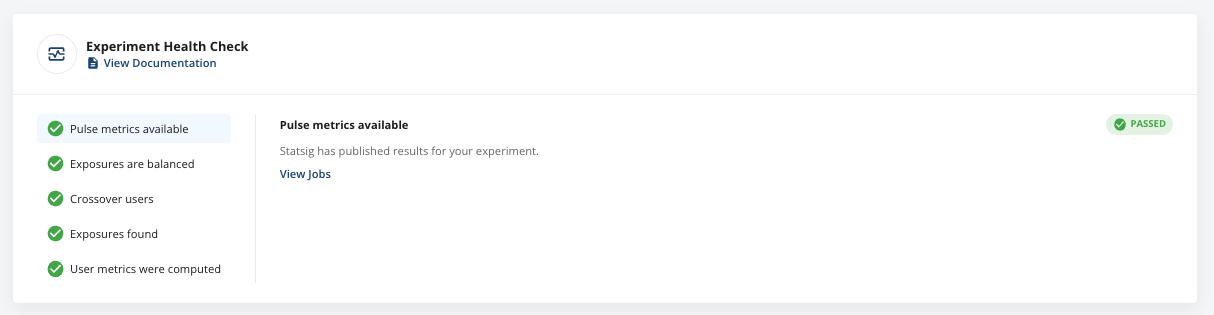
The Diagnostics tab shows the results of statistical and data quality checks. These include:
- Job status. You can also view and copy the SQL that ran for every step of the Pulse analysis.
- Exposure balance between groups. A chi-squared test detects meaningful differences between group populations and the expected split.
- Overlap check: Statsig discards users with exposures in both test and control from Pulse analysis. A large overlap population can reduce power or cause bias.
- Confirmation that exposures were present in the selected analysis range.
- Confirmation that Statsig joined metric data to exposure data. A failure here can indicate a mismatch in IDs or a misconfigured metric.
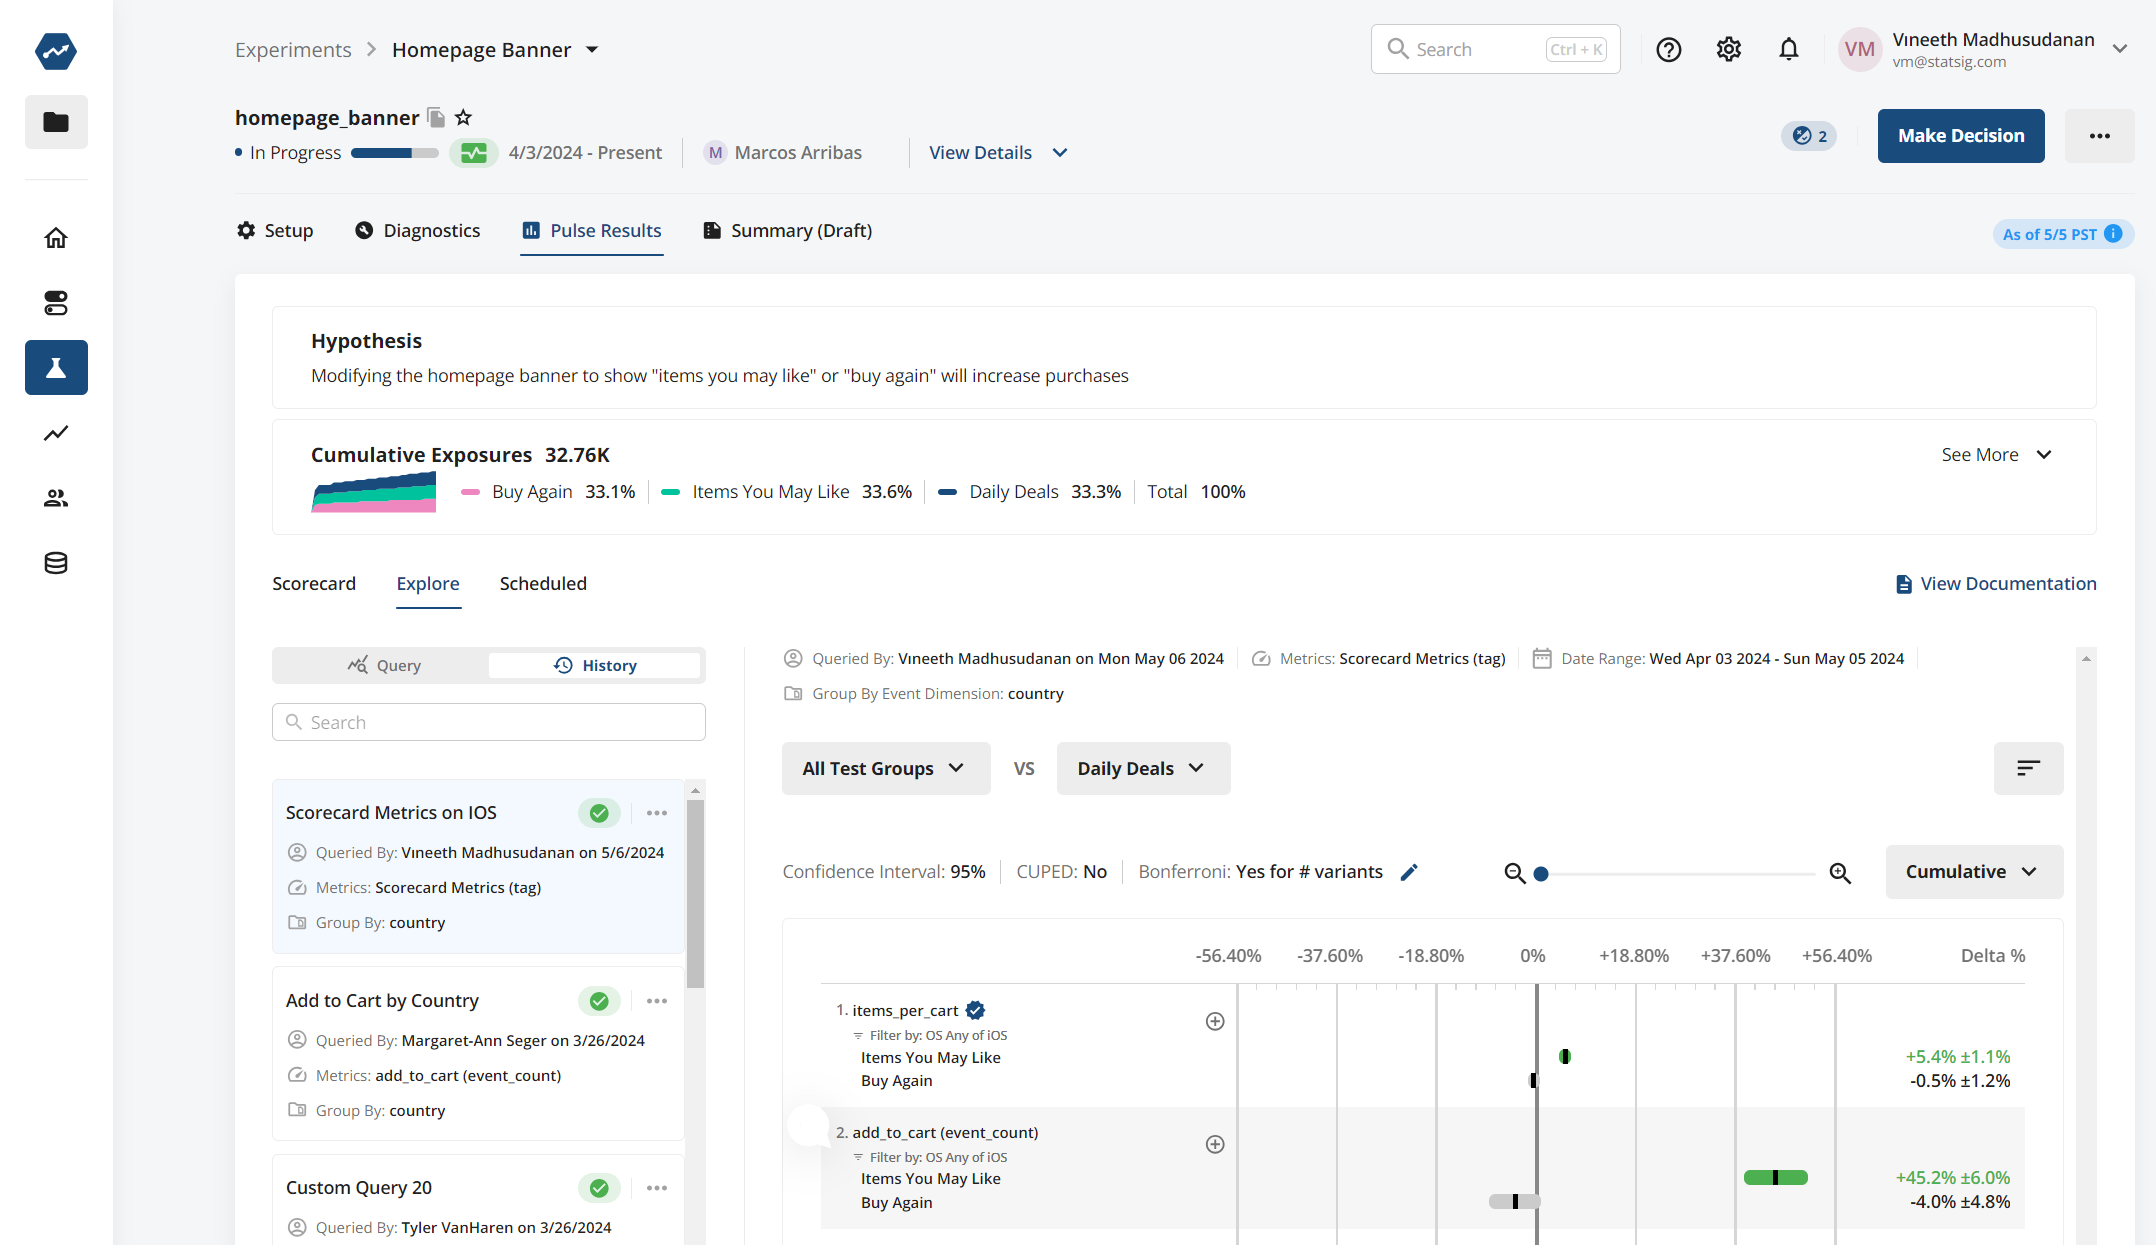
Explore
The Explore tab lets you use user dimensions to drill down and explore results. The Explore tab is useful for diagnostics and hypothesis generation. Treat these results as inconclusive unless the experiment had a specific hypothesis for the target population. You can also select from "special" tags including All Metrics (all metrics in your project) and Scorecard Metrics (all metrics on the experiment scorecard).
Was this helpful?